While COVID-19 affected the world at large and led to nationwide lockdowns and travel restrictions for over a year, some countries have fared better than others in the aftermath of the pandemic. In this scenario, we want to examine the global data collected on the COVID-19 pandemic. Specifically, we are looking at the statistics regarding the deaths, infections, and vaccinations that occurred from January 2020 to August 2023. The questions we want to answer are:
What were the total numbers of reported COVID-19 cases and deaths worldwide since the beginning of the pandemic?
What was the total percentage of each country's population infected by COVID-19 since the beginning of the pandemic?
What is the projected percentage of each country infected by December 2024?
METHODS
To get the most up-to-date information on COVID-19 cases, I downloaded the latest open-access data from the website Our World In Data regarding all recorded infection cases and deaths, from January 2020 to August 2023. The data files for COVID-19 cases, deaths, and vaccinations were uploaded into Microsoft SQL Server Management Studio, and SQL queries were created to organize the relevant data.
During data exploration, aggregate functions were used to total COVID-19 cases, deaths, and vaccinations; CAST to convert values to integers; JOIN to combine the Deaths and Vaccination databases; and CTEs and TEMP tables to create a column showing rolling vaccination counts.
Four queries were constructed showing total worldwide infection cases and deaths, total deaths by continent, and total and daily infections by country. Views for each query were exported as tables into Microsoft Excel and then uploaded into Tableau; the complete SQL code was uploaded to GitHub.
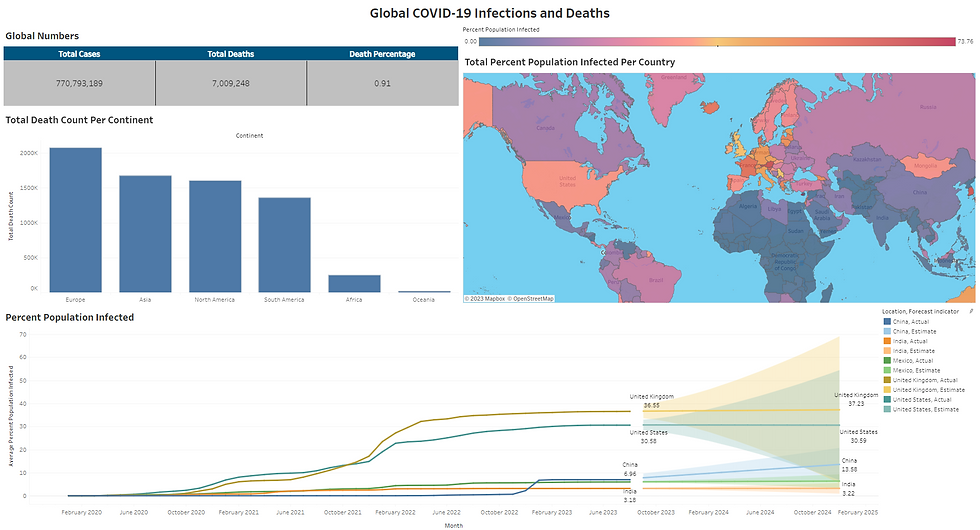
A dashboard was created in Tableau to visualize data from the SQL views. A table shows the total global number of COVID-19 cases and deaths with the percentage of cases resulting in death, and a bar chart breaks down the global deaths by continent. The percentage of the population infected with COVID-19 is filtered by country and shown on an interactive world map, with an associated color gradient representing the range of infection rates from lowest (blue) to highest (red). For select countries (China, India, Mexico, United States, and United Kingdom), an average running total percentage of the population infected are displayed on a timeline by month from January 2020 to August 2023. An estimated forecast for the running total percentage of population infected was also given for each country for each month up to December 2024.
RESULTS
Global COVID-19 cases and deaths
Over 770,000,000 cases of COVID-19 were recorded between January 2020 and August 2023, with total recorded deaths around 7,000,000, meaning that approximately 0.93 out of every 100 COVID-19 cases resulted in death.
The ranking of the continents from most to least COVID-19 deaths was Europe, Asia, North America, South America, Africa, and Oceania. As the continent with the most COVID-19 deaths, Europe had about 2,077,000 related deaths, approximately 29.6% of all global COVID-19 deaths. The two continents with the least COVID-19 deaths, Africa and Oceania, together account for 289,568 related deaths, only slightly more than 4.13% of all global COVID-19 deaths.
Percentage of population infected by country
From the map some of the countries with the highest COVID-19 infection rates by population are Cyprus, (73.76%), Brunei (69.16%), Austria (68.03%), South Korea (66.72%), Slovenia (63.44%), and France (57.51%). The majority of countries with high COVID-19 infection rates over 50% are located in Europe and Asia.
From the timeline, a visible spike in the percentage of population infected can be seen from November 2020 to January 2021, which coincides with the increase in travel around the holidays and an increase in COVID-19 spread. A second much larger spike around November 2021 to February 2022, due to both the holiday season and to the spread of the new Delta and Omicron variants of COVID-19.
Interestingly, China's infection percentage remained incredibly low (<1%), which can been attributed to underreporting of COVID-19 cases by the Chinese government, until a huge spike in infections around November 2022 to January 2023. This spike was most likely caused by ineffective lockdown procedures, followed by the immediate loosening of those procedures.
Projected Infection Percentage by December 2024
Of the 5 selected countries, the United Kingdom and United States have percentage of population infected at 36.55% and 30.56% respectively. China, Mexico, and India have relatively lower percentages at 6.96%, 6.00%, and 3.18% respectively.
Of the 5 selected countries, China is the only one projected to suffer a significant increase in COVID-19 cases by population, increasing from 6.96% in August 2023 to 13.58% by December 2024. The remaining countries are all expected to maintain a less than 1% increase in the same timeframe.
SUMMARY
This analysis indicates that most COVID-19 cases and deaths have been concentrated in European and Asian countries. While countries like United States had the largest number of COVID-19 cases for an individual country, the countries with the largest total percentage of cases by population were primarily in Europe and Asia. Additionally, while developed countries like the United States, United Kingdom, India, and Mexico are projected to keep future COVID-19 infection rates low, countries like China are projected to see a rise in infection rates in the near future.
The reasons for this rise in infections in China can be at least partly attributed to China's handling of its "Zero-Covid" policy. While China was one of the first countries to implement lockdowns and containment policies in response to the COVID-19 pandemic, they also ended these policies all at once in late 2022 in response to protests before enough of the vulnerable population had been vaccinated. The immediate and sudden ending of all lockdowns, travel restrictions, and mass testing led to a large increase in millions of COVID-19 infections. Additionally, China relied primarily on inactivated whole virus vaccines rather than the more effective mRNA vaccines, which led to less prevention for future COVID-19 variants like Omicron. Chinese citizens also had a strong degree of vaccine hesitancy due to poor vaccine manufacturing quality in the country.
To prevent the rise in future infection rates, lockdown procedures should be put in place more immediately once new infections are identified until vaccines are able to be rolled out. Lockdowns should be loosened slowly and over time once most of the population has been reasonably vaccinated. Quality control for vaccines also needs to be of the highest priority to ensure prevention against future strains and to reduce vaccine hesitancy among the population.
Click on the GitHub and Tableau icons below to view both the SQL script and interactive Tableau visualizations respectively.


Comments